Microsoft Skills | 2026

Org Reporting

Designing a centralized organization-level reporting experience to help Learning and Skill Development admins track learning adoption, engagement, completion, skills, and certification outcomes across AI Skill Navigator.

User scenario

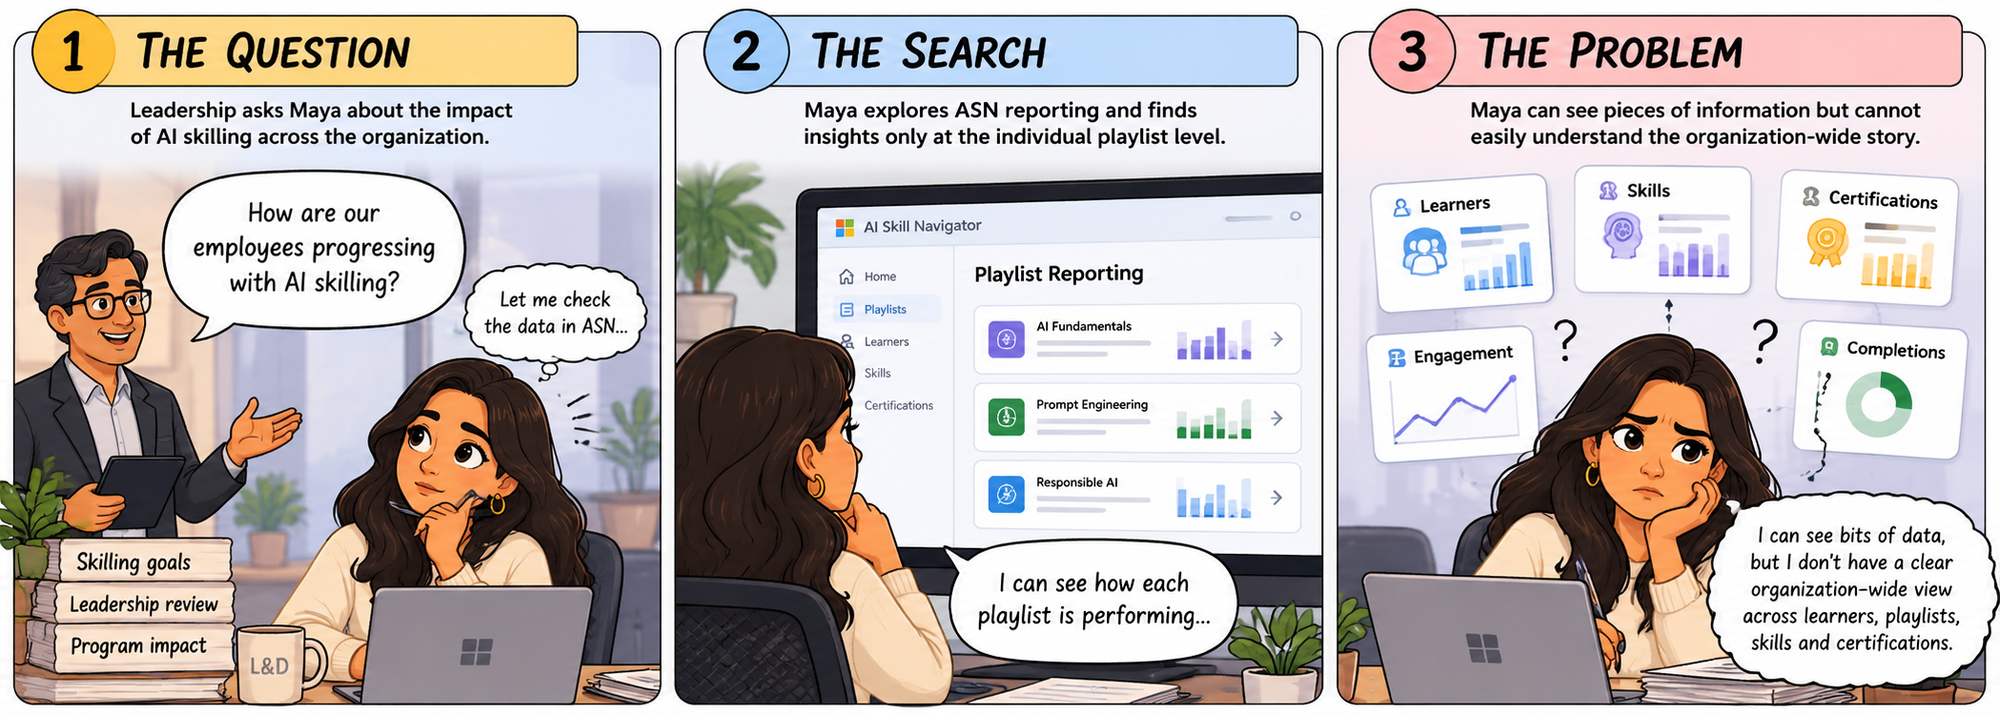
Three-part journey showing Maya receiving a leadership question about AI skilling, searching playlist-level reporting, and struggling to assemble an organization-wide story across learners, skills, engagement, certifications, and completions

The data exists.
The organizational story doesn’t.

  1. Playlist-level visibility Insights are primarily centered around individual playlists rather than overall organizational learning.
  2. No centralized organizational view Admins lack one place to understand overall AI Skill adoption and engagement.
  3. Limited learner visibility Understanding how learners are progressing across learning experiences is difficult.
  4. Limited skill visibility Admins cannot easily connect learning activity with the skills being developed.
  5. Certification outcomes are disconnected Certification information is not easily connected to the broader learning story.
  6. Difficult to answer leadership questions Admins have to piece together information before understanding overall program performance.

Customer voices

“What are employees actually using AI for?”
“Are learners engaging with the programs we created?”
“How many learners are completing their learning?”
“Which skills are employees developing?”

The challenge wasn’t a lack of data.

It was turning fragmented data into meaningful organizational insight.

Design opportunity

Process exploration

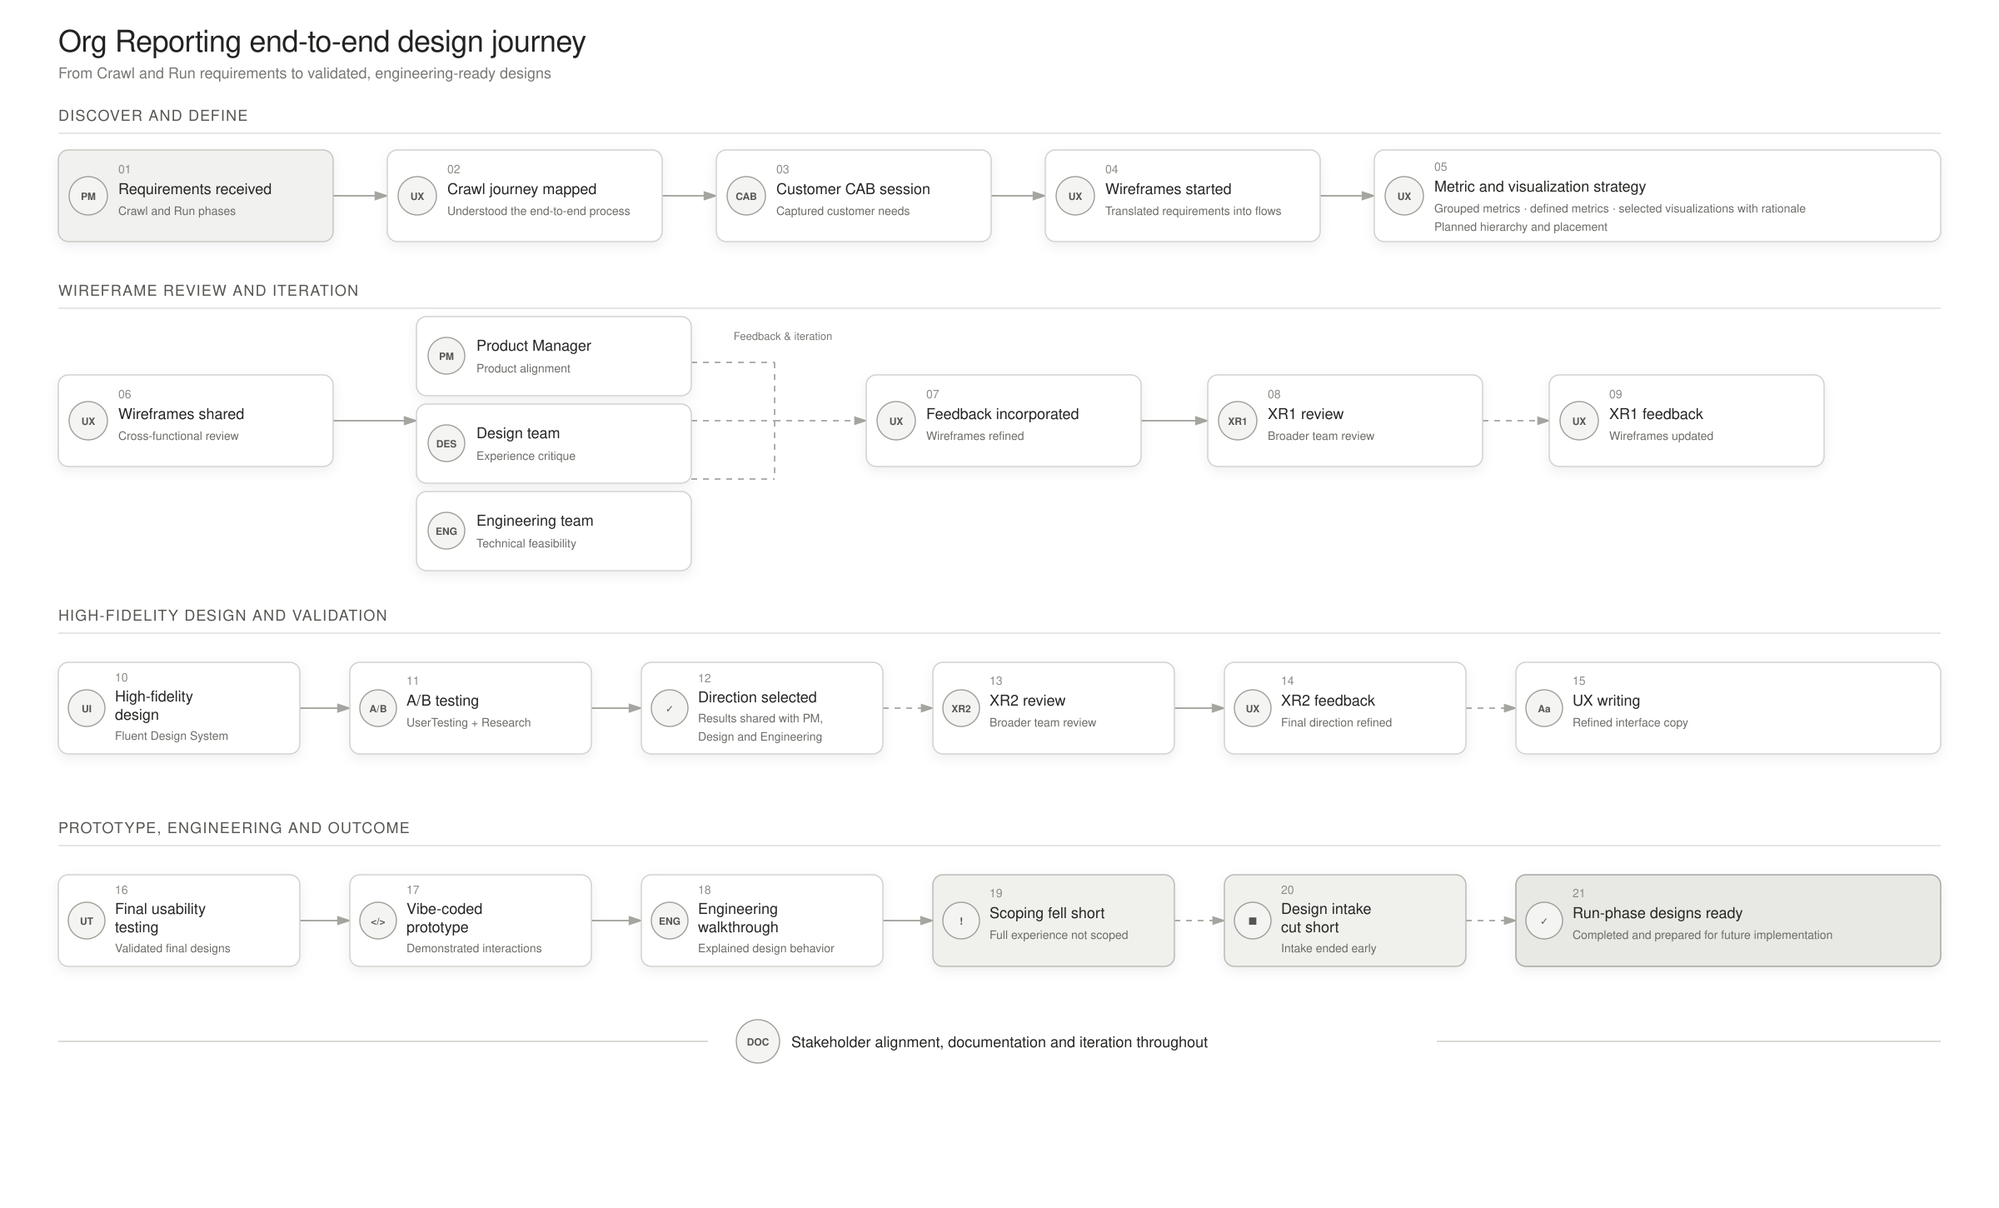
Org Reporting end-to-end design journey map, from Crawl and Run requirements through discovery, wireframe review, high-fidelity validation, and prototype and engineering handoff

Design direction

User testing

I conducted remote usability testing through the UserTesting platform to evaluate how effectively the reporting experience communicated complex learning data to L&D administrators.

Participants completed two realistic scenarios using interactive prototypes while thinking aloud. I used an A/B testing approach to compare two design directions and understand which version offered clearer information hierarchy, stronger data comprehension, and more intuitive interactions.

01

What I Evaluated

  • Clarity and usefulness of the reporting metrics
  • Ability to identify important insights quickly
  • Comprehension of charts, labels, and terminology
  • Discoverability of key actions
  • Expectations around the completion interaction
  • Understanding of empty states and messages
  • Overall preference between Design A and Design B
02

Research Approach

Participants explored both concepts, completed the assigned tasks, and explained what they expected to happen at each stage. I observed their behavior, captured areas of hesitation or confusion, and followed up with questions to understand the reasoning behind their choices.

03

Key Findings

Testing revealed which design made the reporting story easier to scan and understand. Participants responded more positively to the direction with a clearer hierarchy, stronger grouping of related information, and more visible primary actions.

The sessions also uncovered opportunities to simplify terminology, strengthen interaction cues, and make empty-state messaging more useful and actionable.

04

Design Outcome

Based on the findings, I selected the stronger design direction and refined the experience by:

  • Improving the hierarchy of key metrics
  • Clarifying labels and supporting copy
  • Increasing the visibility of important actions
  • Refining the completion interaction
  • Making empty states clearer and more informative
  • Reducing the effort required to interpret reporting insights
Impact

Organizational
Visibility

From individual playlist insights → centralized organization-level reporting

Decision
Clarity

From disconnected metrics → structured adoption, engagement, completion and outcome insights

Outcome
Visibility

From primarily learning activity → skills and certification visibility

Unified Reporting
Experience

Brought previously separate insights together into one connected reporting experience